Report Analyzer Admin Guide
Gainsight NXT
This article supports Gainsight NXT, the next evolution of the Customer Success platform. If you are using Gainsight CS Salesforce Edition, you can find supporting documentation by visiting the home page, and selecting CS > Salesforce Edition.
Not sure what your team is using? Click here.
重要 - 画像/情報は四半期ごとのリリースで更新されます!
四半期ごとのリリースにて、最新の機能・情報を反映し、画像を含めた情報は更新されます。
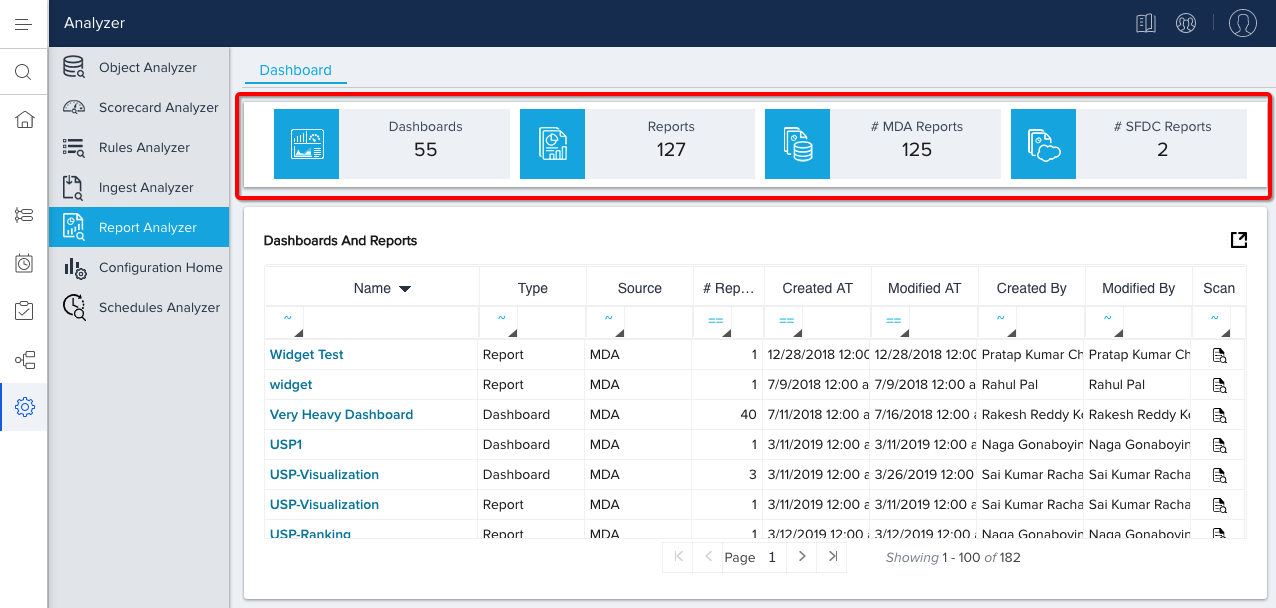
Report Analyzer gives you the ability to scan any report in your org and then provides insights to improve performance. This feature has a dashboard summary as well as sections that display all dashboards and reports, dashboard audit stats, the number of reports by object, and the number of reports not in a dashboard.
To access the Report Analyzer, navigate to Administration > Analyzer > [click on the Report Analyzer icon on the left slider].
Summary
The Report Analyzer displays a quick view summary of your org’s Dashboard and Reports arranged in tiles at the top of the screen. This summary includes the number of Dashboards, total number of Reports, total number of MDA Reports, and total number of SFDC Reports in the Org.
Dashboards and Reports
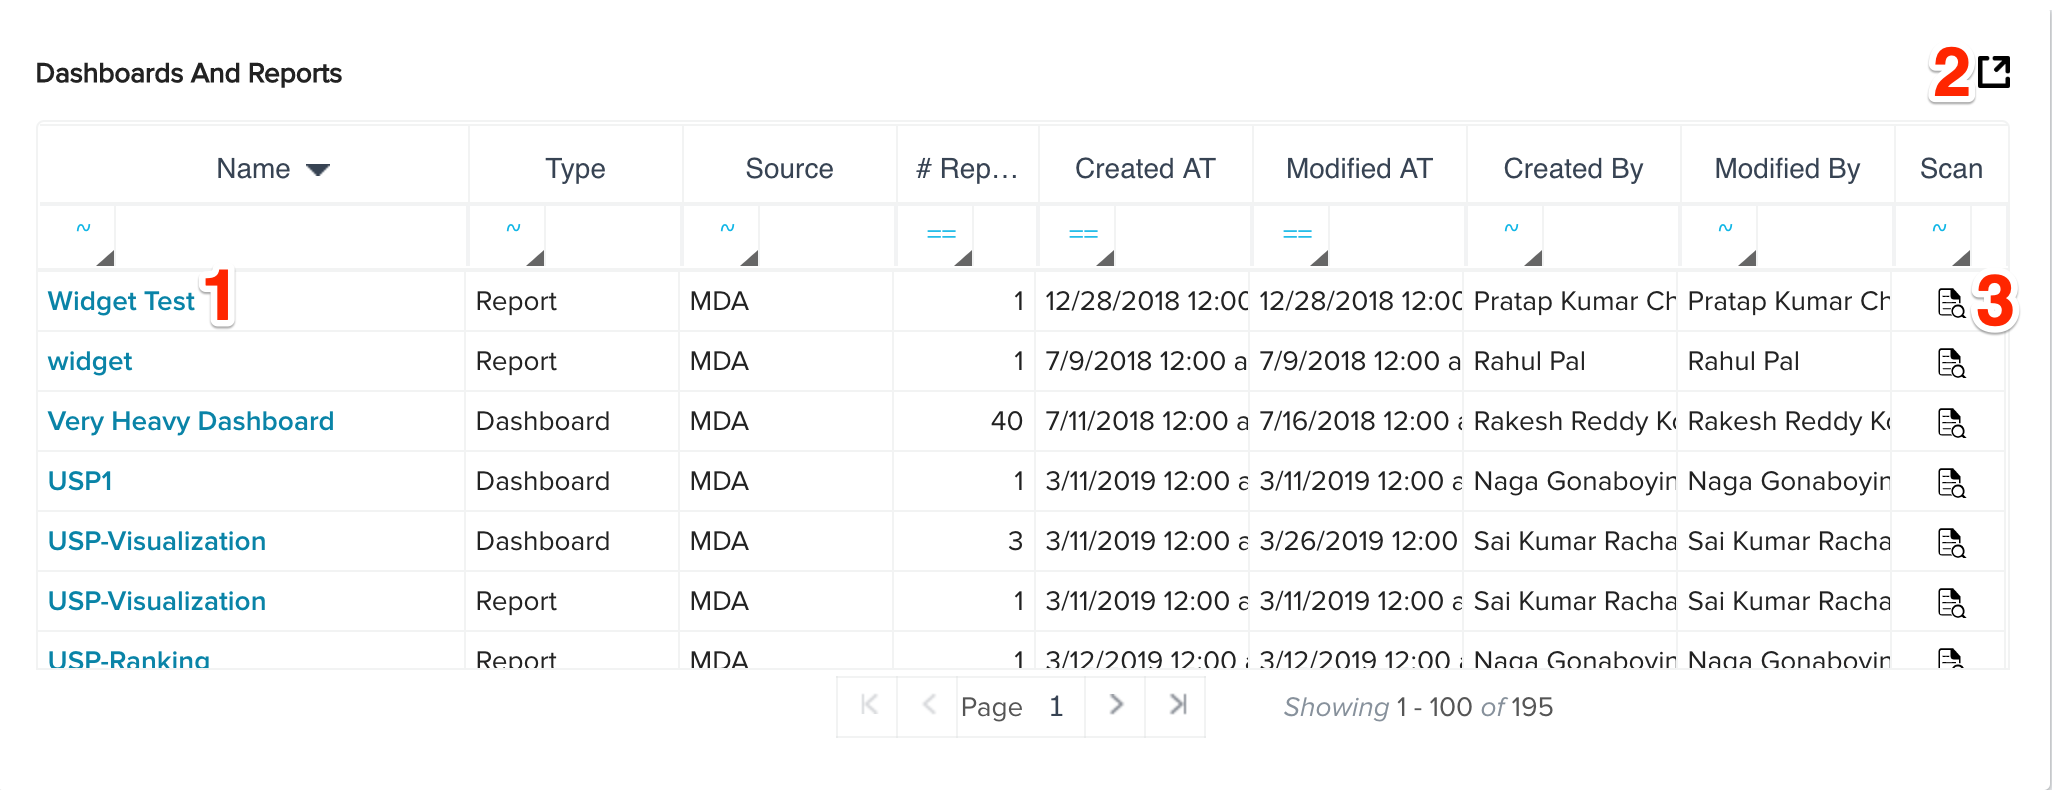
The Dashboards and Reports section displays data from every report and dashboard in your org. This data includes the report or dashboard’s name, type, source, number of reports, the timestamp when it was created, the timestamp when it was last modified, who created it, and who last modified it. The scan icon is displayed at the end of each entry.
-
Dashboard/Report Name: Click any dashboard or report name to open the entry in Report Builder. For more information on building or editing reports, refer to How to Build Basic Reports.
-
Export: Click this icon to export the report as an excel file.
-
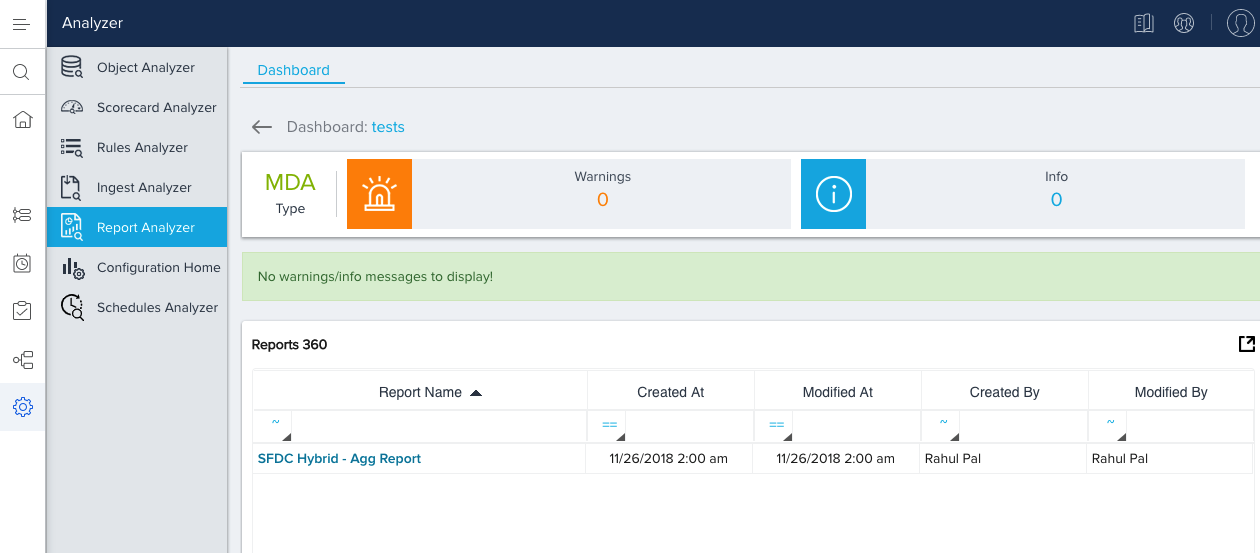
Scan: Clicking on the Scan icon displays a window containing a detailed analysis of the Dashboard or Report. For Dashboards, this analysis includes data on each report it contains such as the report’s name, the timestamp when it was created, the timestamp when it was last modified, who created it, and who last modified it.
If the Dashboard’s performance can be optimized further a Warning is displayed which describes the improvement area. You can click on the expand icon beside each warning message. This provides a deep dive on the cause and how it can be corrected.
If there are no warnings, a message to that effect is displayed as shown in the following image.
Report Warning/Error Messages
The table below lists every possible Report Analyzer warning/error message.
|
Warning/Error |
Detail |
Scan Points |
|---|---|---|
|
Having more number of show fields |
The following reports have more than ${maxShowFields} show fields. Keep only the necessary fields as part of show fields of a report(s) |
Warning |
|
Having more 'Or' conditions |
The following report(s) have more than ${maxOrFilters} 'Or' conditions. 'Or' conditions reduce the performance. |
Warning |
|
Uses 'Contains' or 'Does Not Contain' filter |
The following report(s) are using 'Contains' or 'Does Not Contain' filter conditions, which can potentially reduce the performance of report(s). Consider using '=' or '!=' operators. |
Warning |
Dashboard Audit Stats
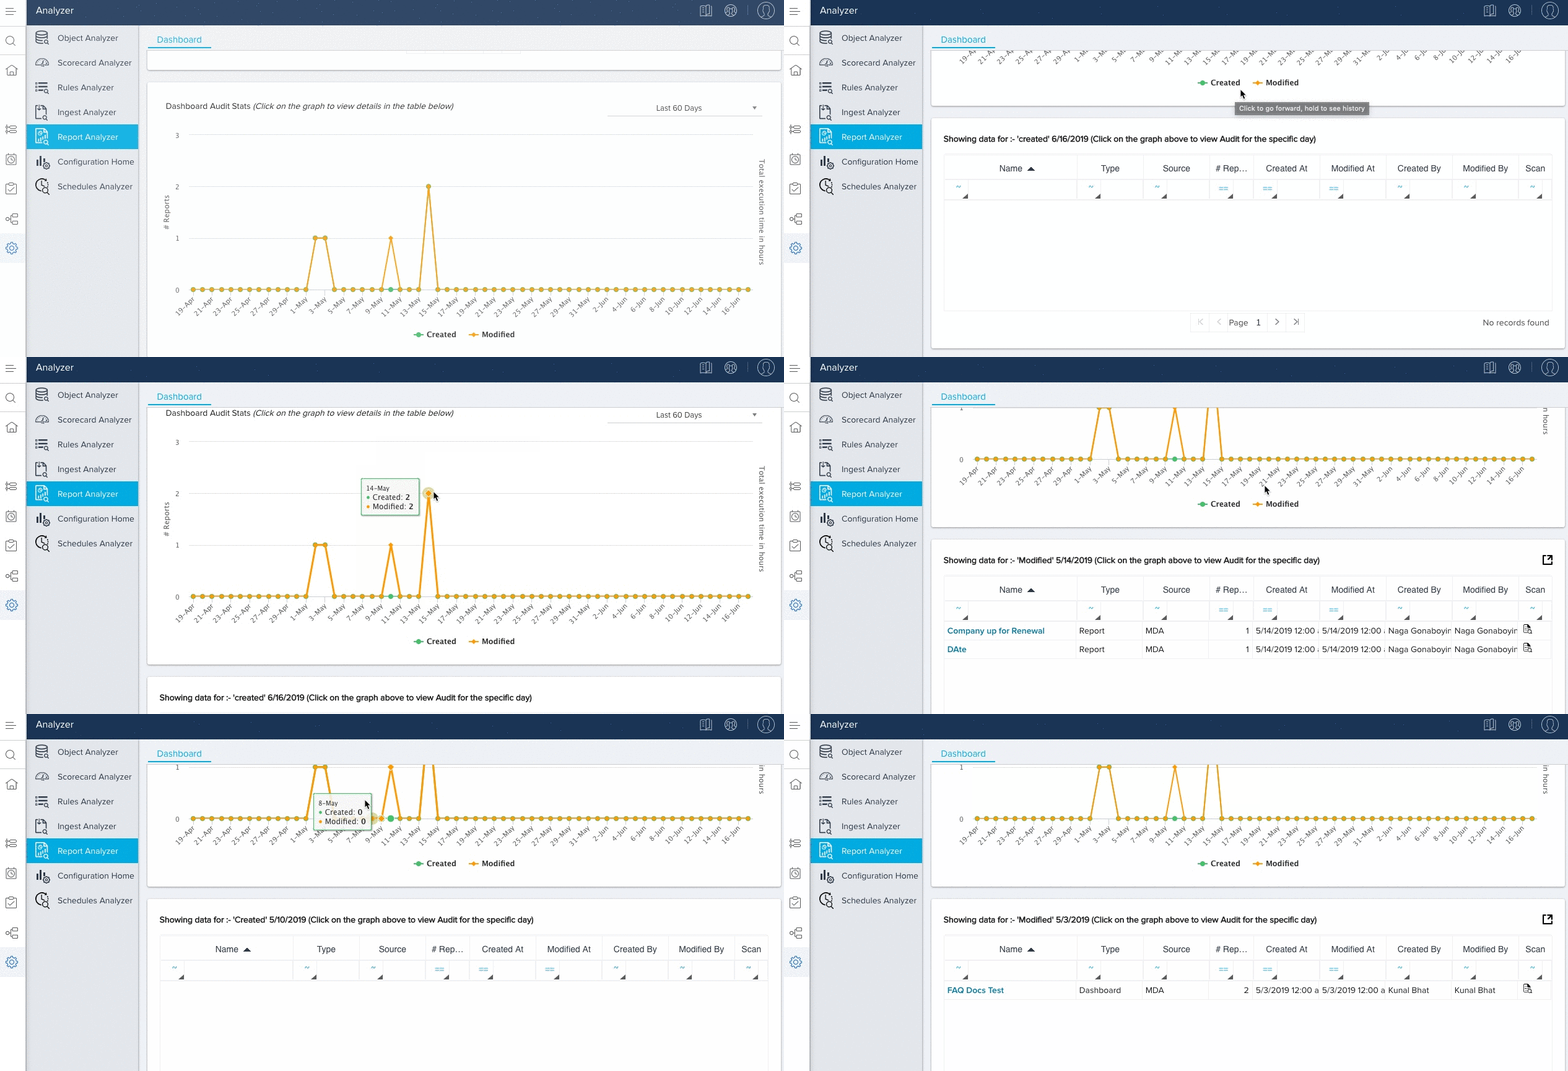
This section contains a graphical representation of all the Reports created and modified in the configured time period (set to 30 days by default). Hovering over a date in the graph will open a quick view of the number of Reports created/modified on that date.
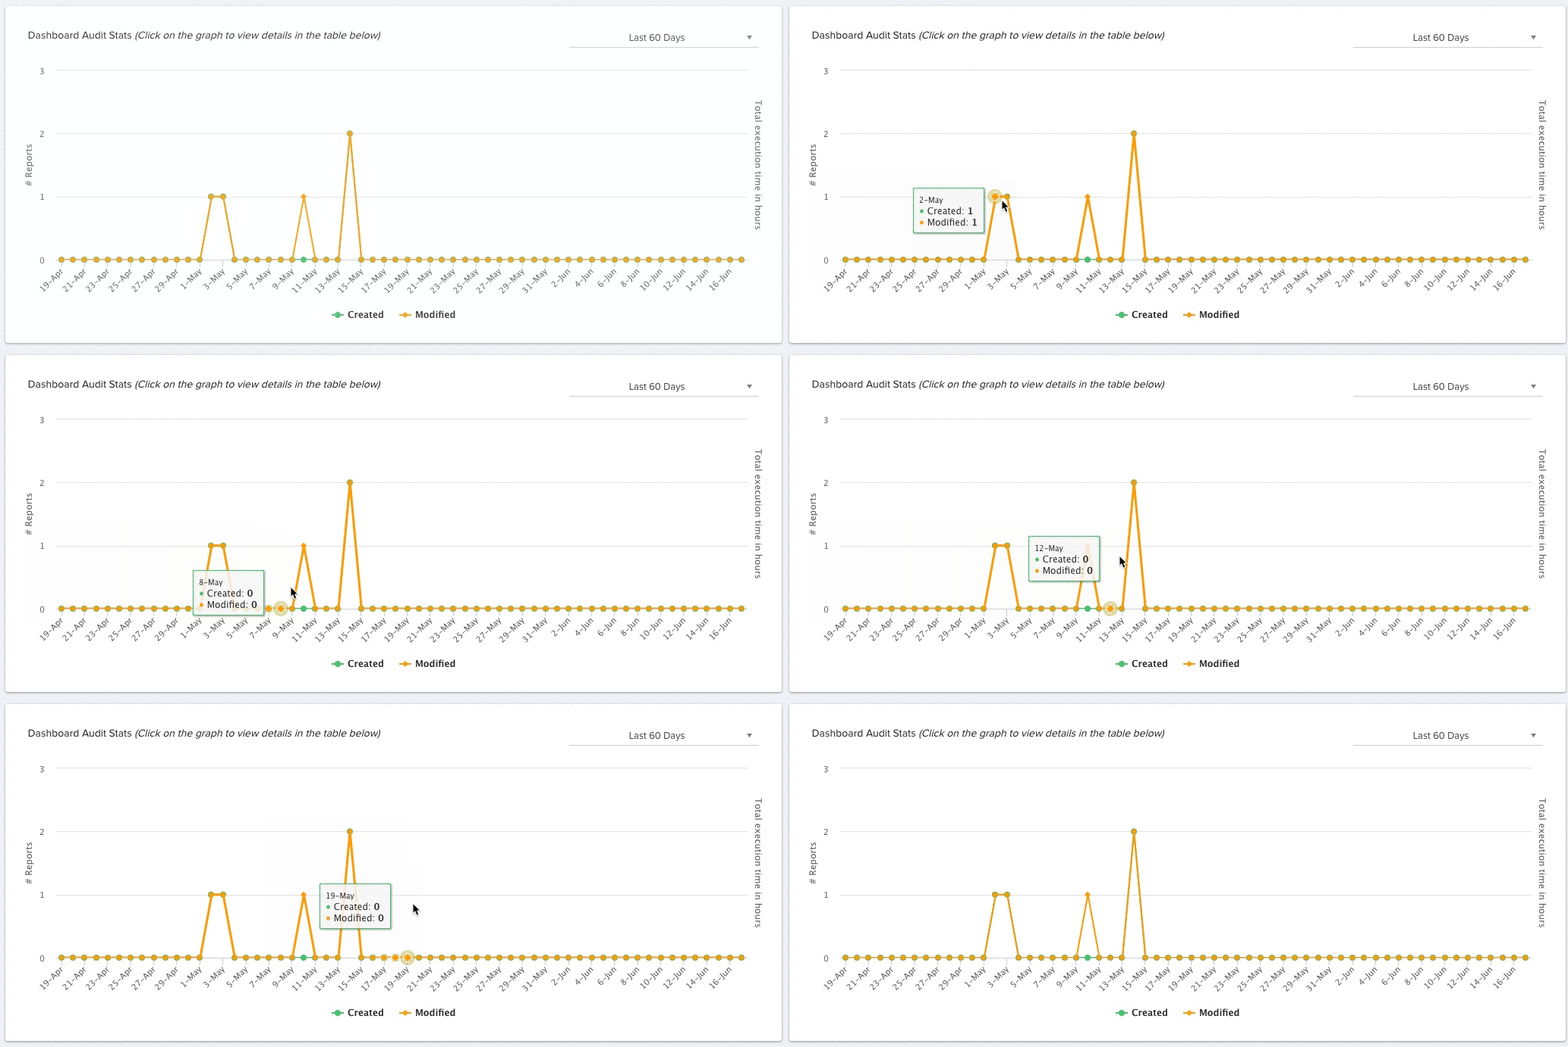
You can click on each date in this section for a more detailed view of the Reports created or modified on that specific date. This data is displayed in the section below, and includes the report’s name, type, source, number of reports, the timestamp when it was created, the timestamp when it was last modified, who created it, and who modified it. The scan icon displays at the end of each entry.
Number of Reports by Object
This section contains the names of every Object in your org along with the number of Reports in each of those Objects. You can click the number to display a pop-up window containing all the reports within the object. This window displays the report’s name, the timestamp when it was created, the timestamp when it was last modified, who created it, and who last modified it. If the Object has a large number of Reports, you can type the name of the required Report in the search box to access it.
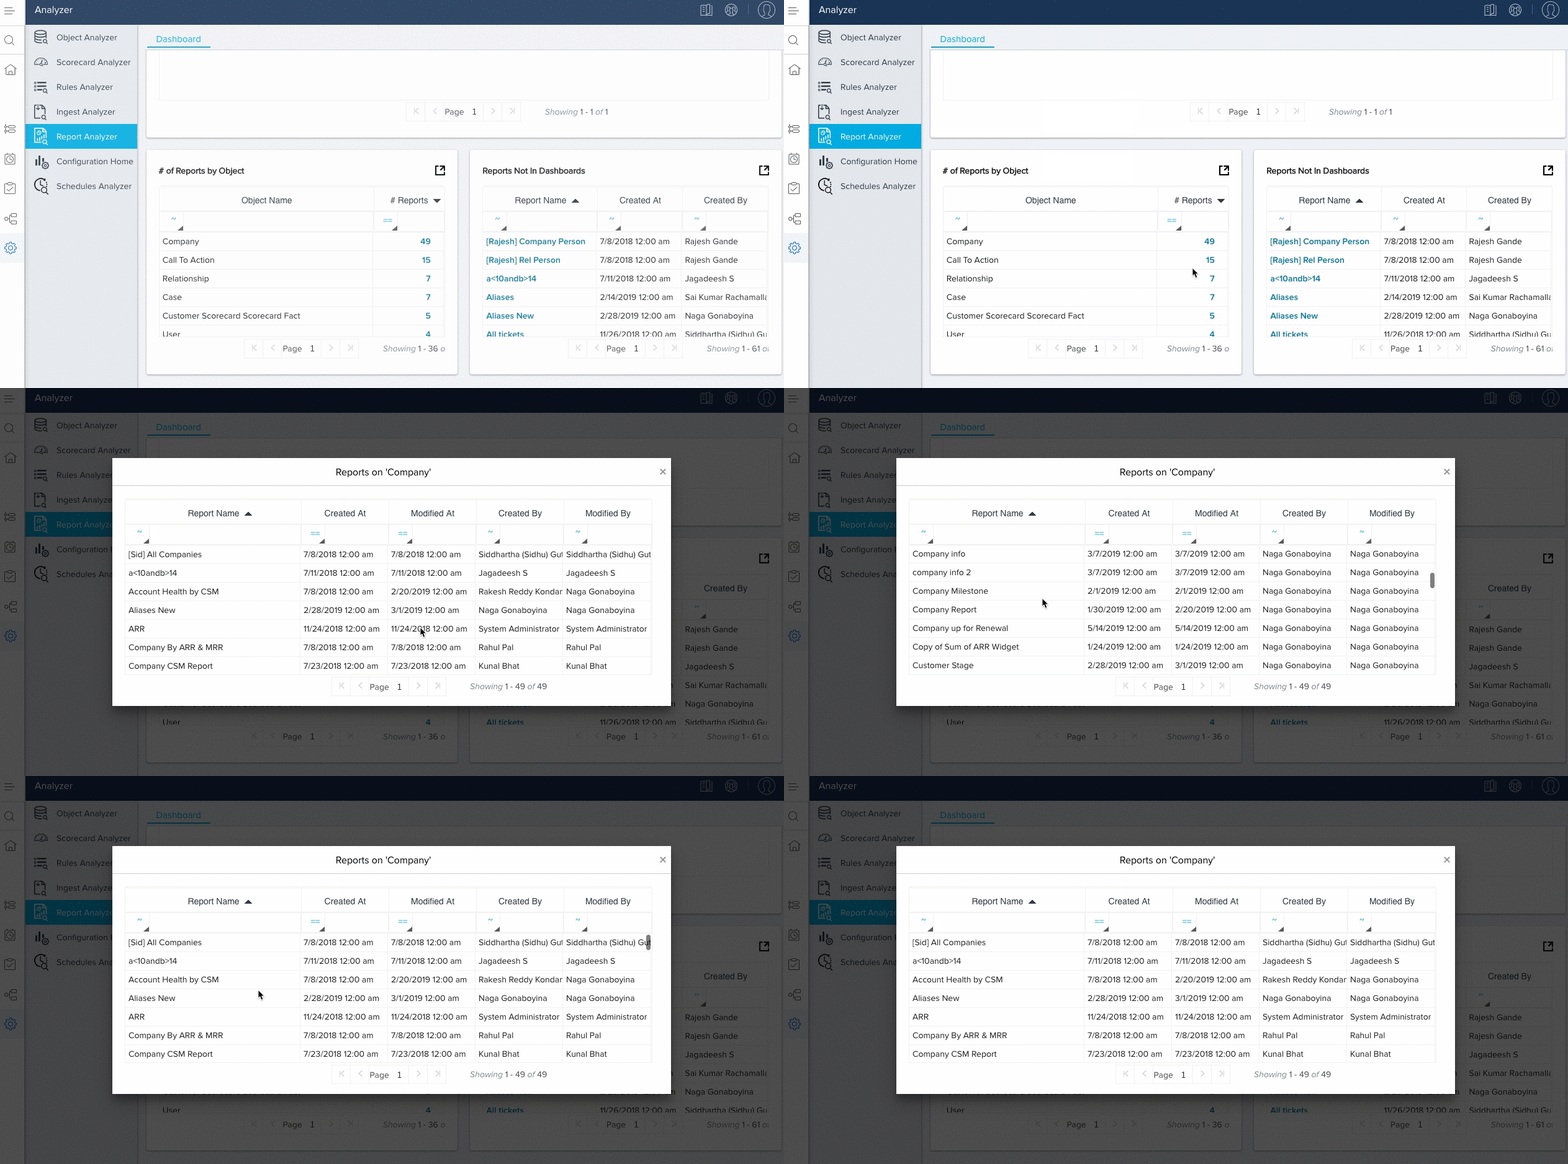
You can click the export icon to export it as an excel file.
Reports Not in Dashboards
This section lists out all the Reports that are not linked to a Dashboard, along with the Created Date and Created By Information. Clicking on a Report’s Name, opens the report in Report Builder in a separate tab.
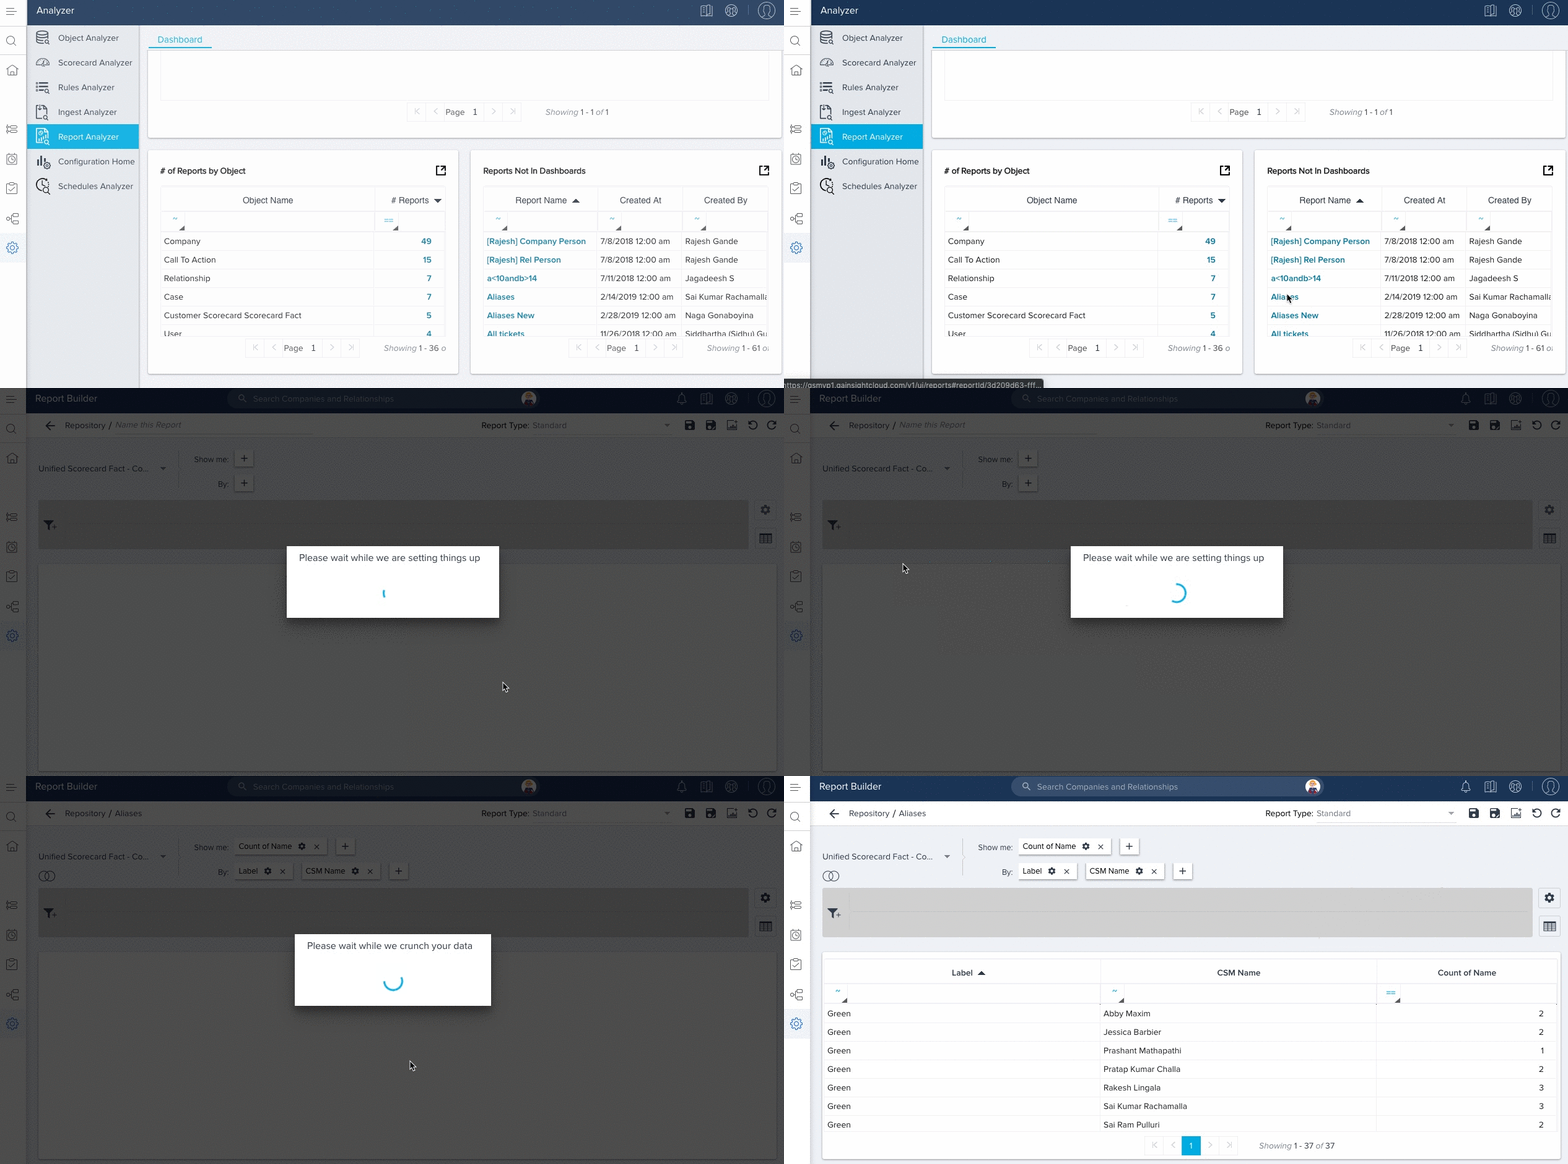
You can click the export icon to export it as an excel file.

