Gainsight Integration with Tableau
Gainsight NXT
This article supports Gainsight NXT, the next evolution of the Customer Success platform. If you are using Gainsight CS Salesforce Edition, you can find supporting documentation by visiting the home page, and selecting CS > Salesforce Edition.
Not sure what your team is using? Click here.
This article explains how admins can connect Tableau to Gainsight data and build reports on Gainsight Data in Tableau.
Overview
Gainsight’s integration with Tableau allows admins to quickly connect their Gainsight instance. This integration allows admins to access all the Gainsight objects in Tableau, and build reports on the customer success data.
Business Use Case: Admin wants to join Gainsight data with other data sources that are already available in Tableau.
IMPORTANT: Exporting any large object that takes a long time for the data to process is not possible with Gainsight-Tableau integration. To overcome this, it is recommended to export only the data that is required to create reports. Also, Gainsight encourages you to create smaller objects using Data Designer in case you need to export objects with a large amount of data.
Integrate Gainsight Data to Tableau
To integrate a Gainsight instance with Tableau:
- Open your Tableau Desktop account or Tableau Public edition.
- Navigate to Connect > To a Server.
- Select Web Data Connector. The Web Data Connector page appears.
- Paste this https://gateway.gainsightcloud.com/v1/public/tableau/wdc URL in the Enter your web data connector URL here text box.
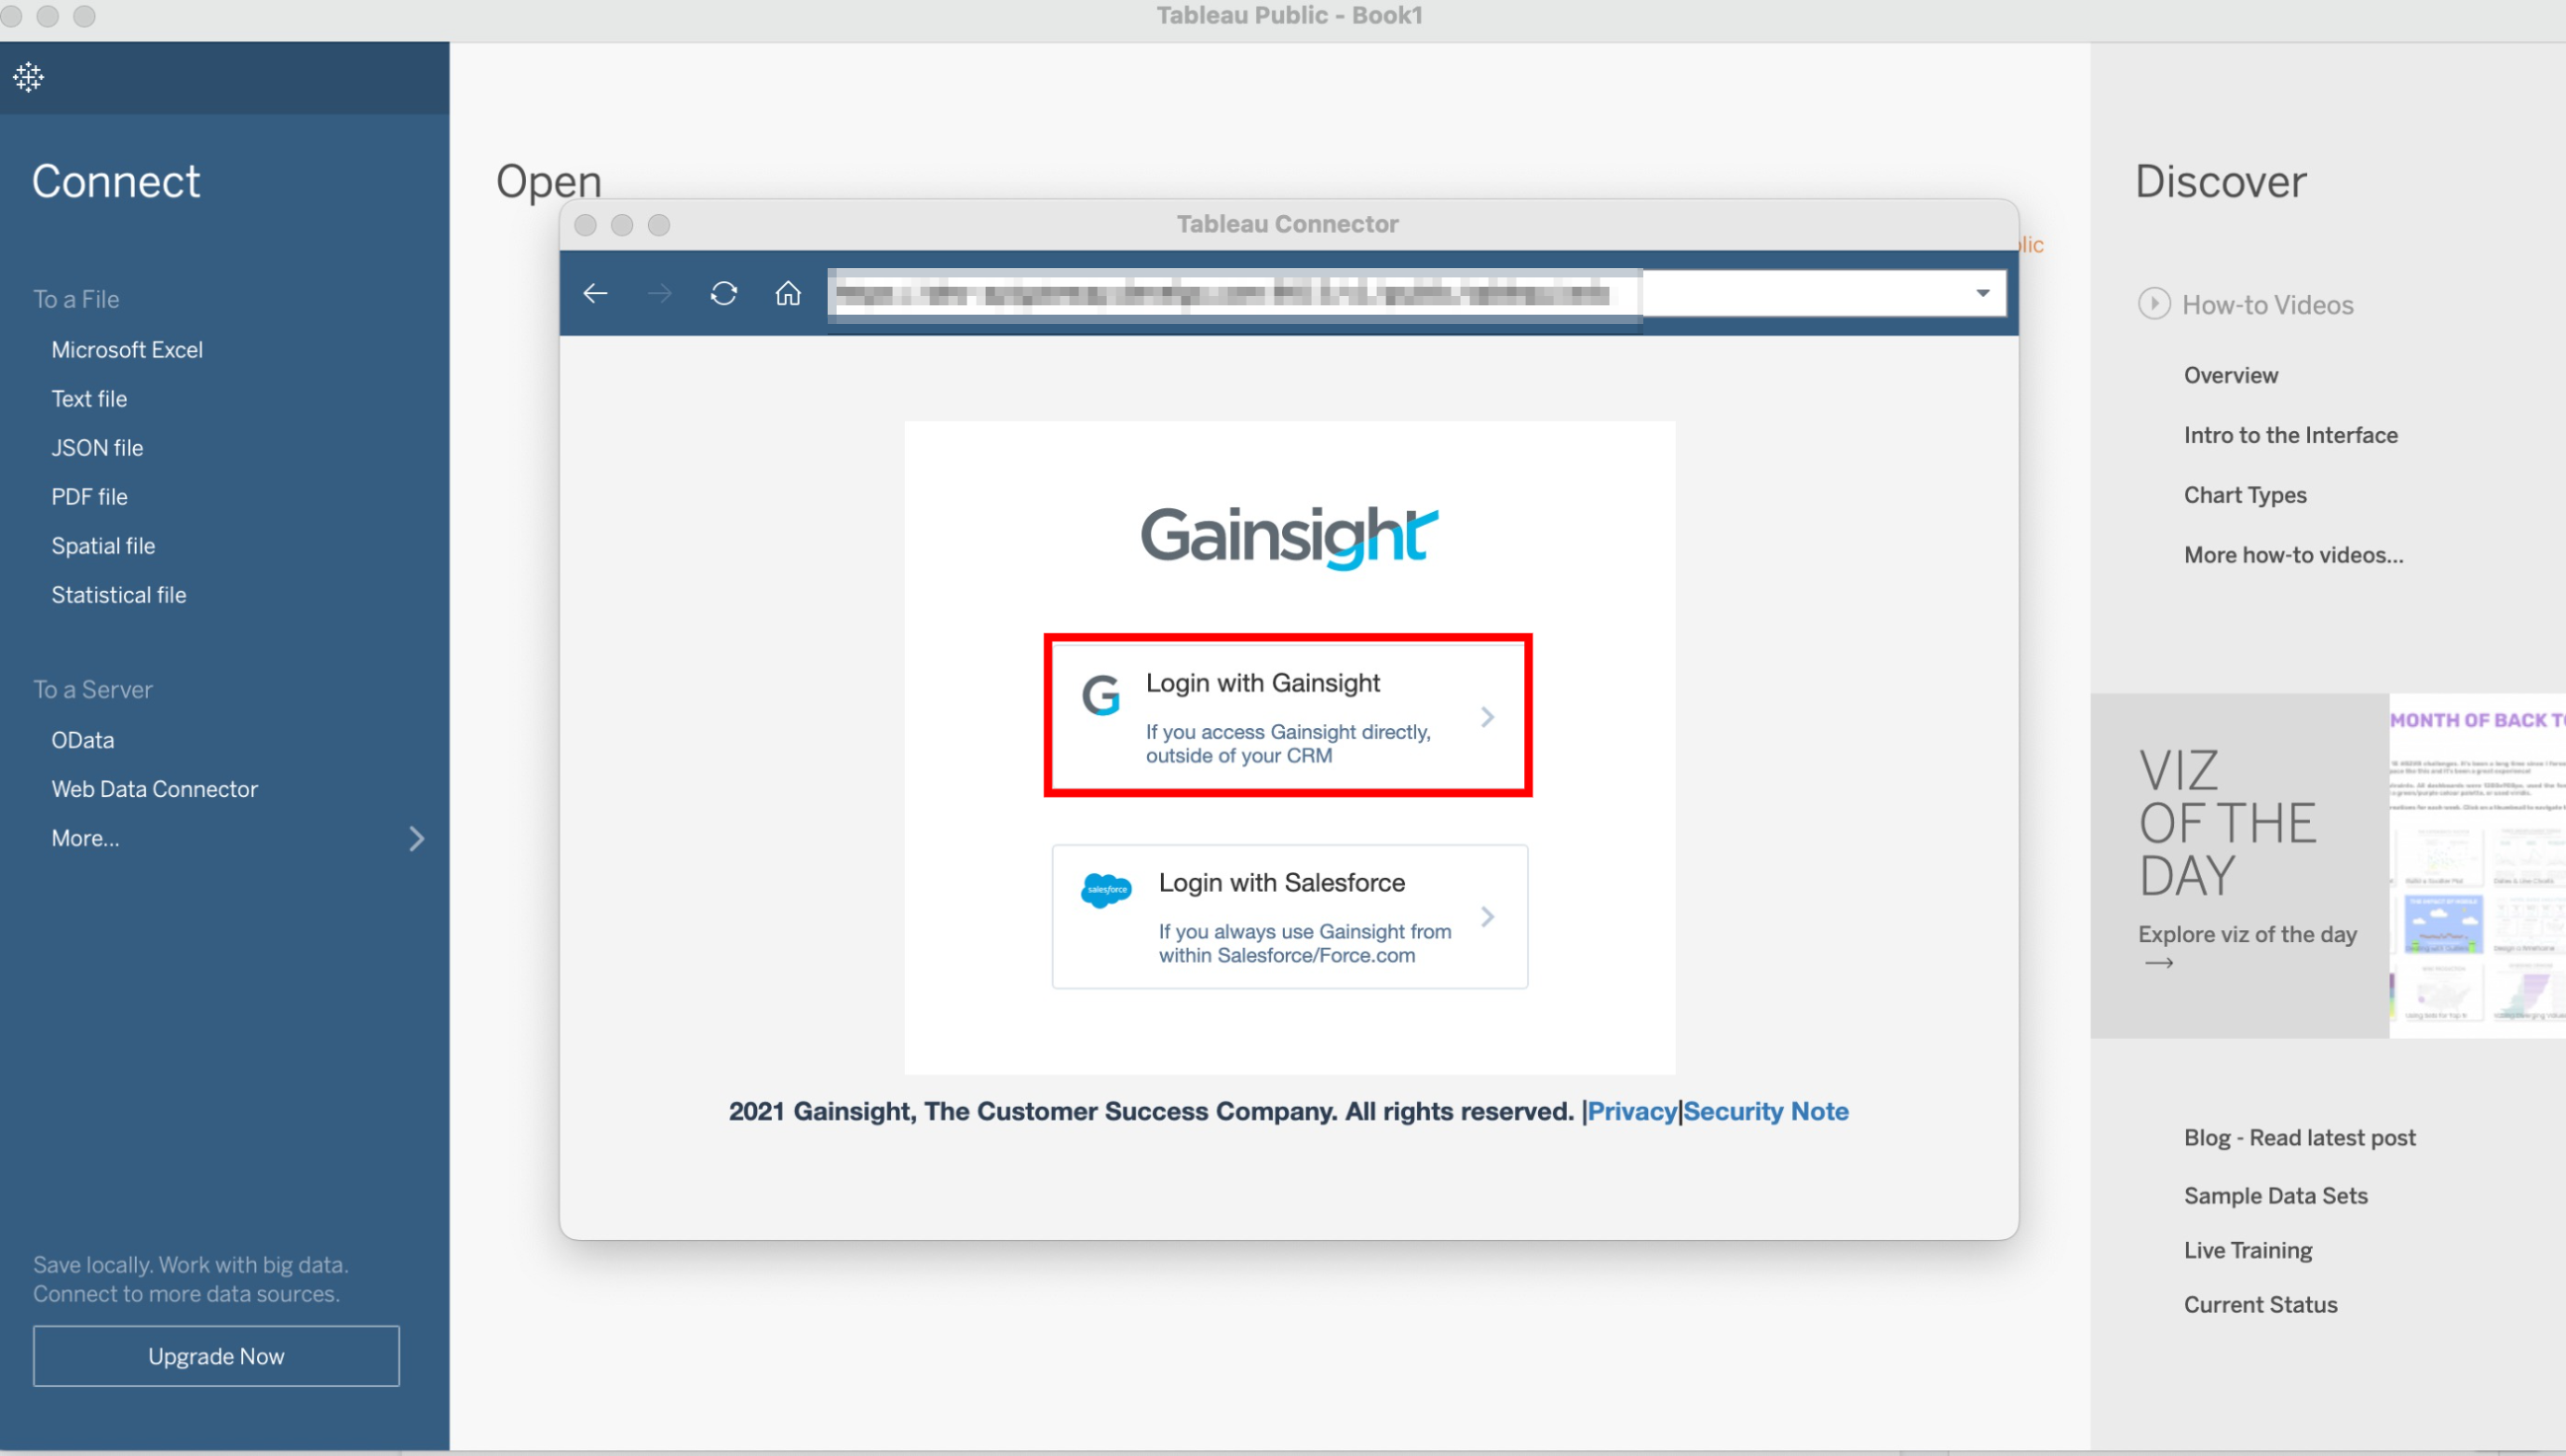
- Press the Enter key. The Gainsight login page appears.
- Click Login with Gainsight.
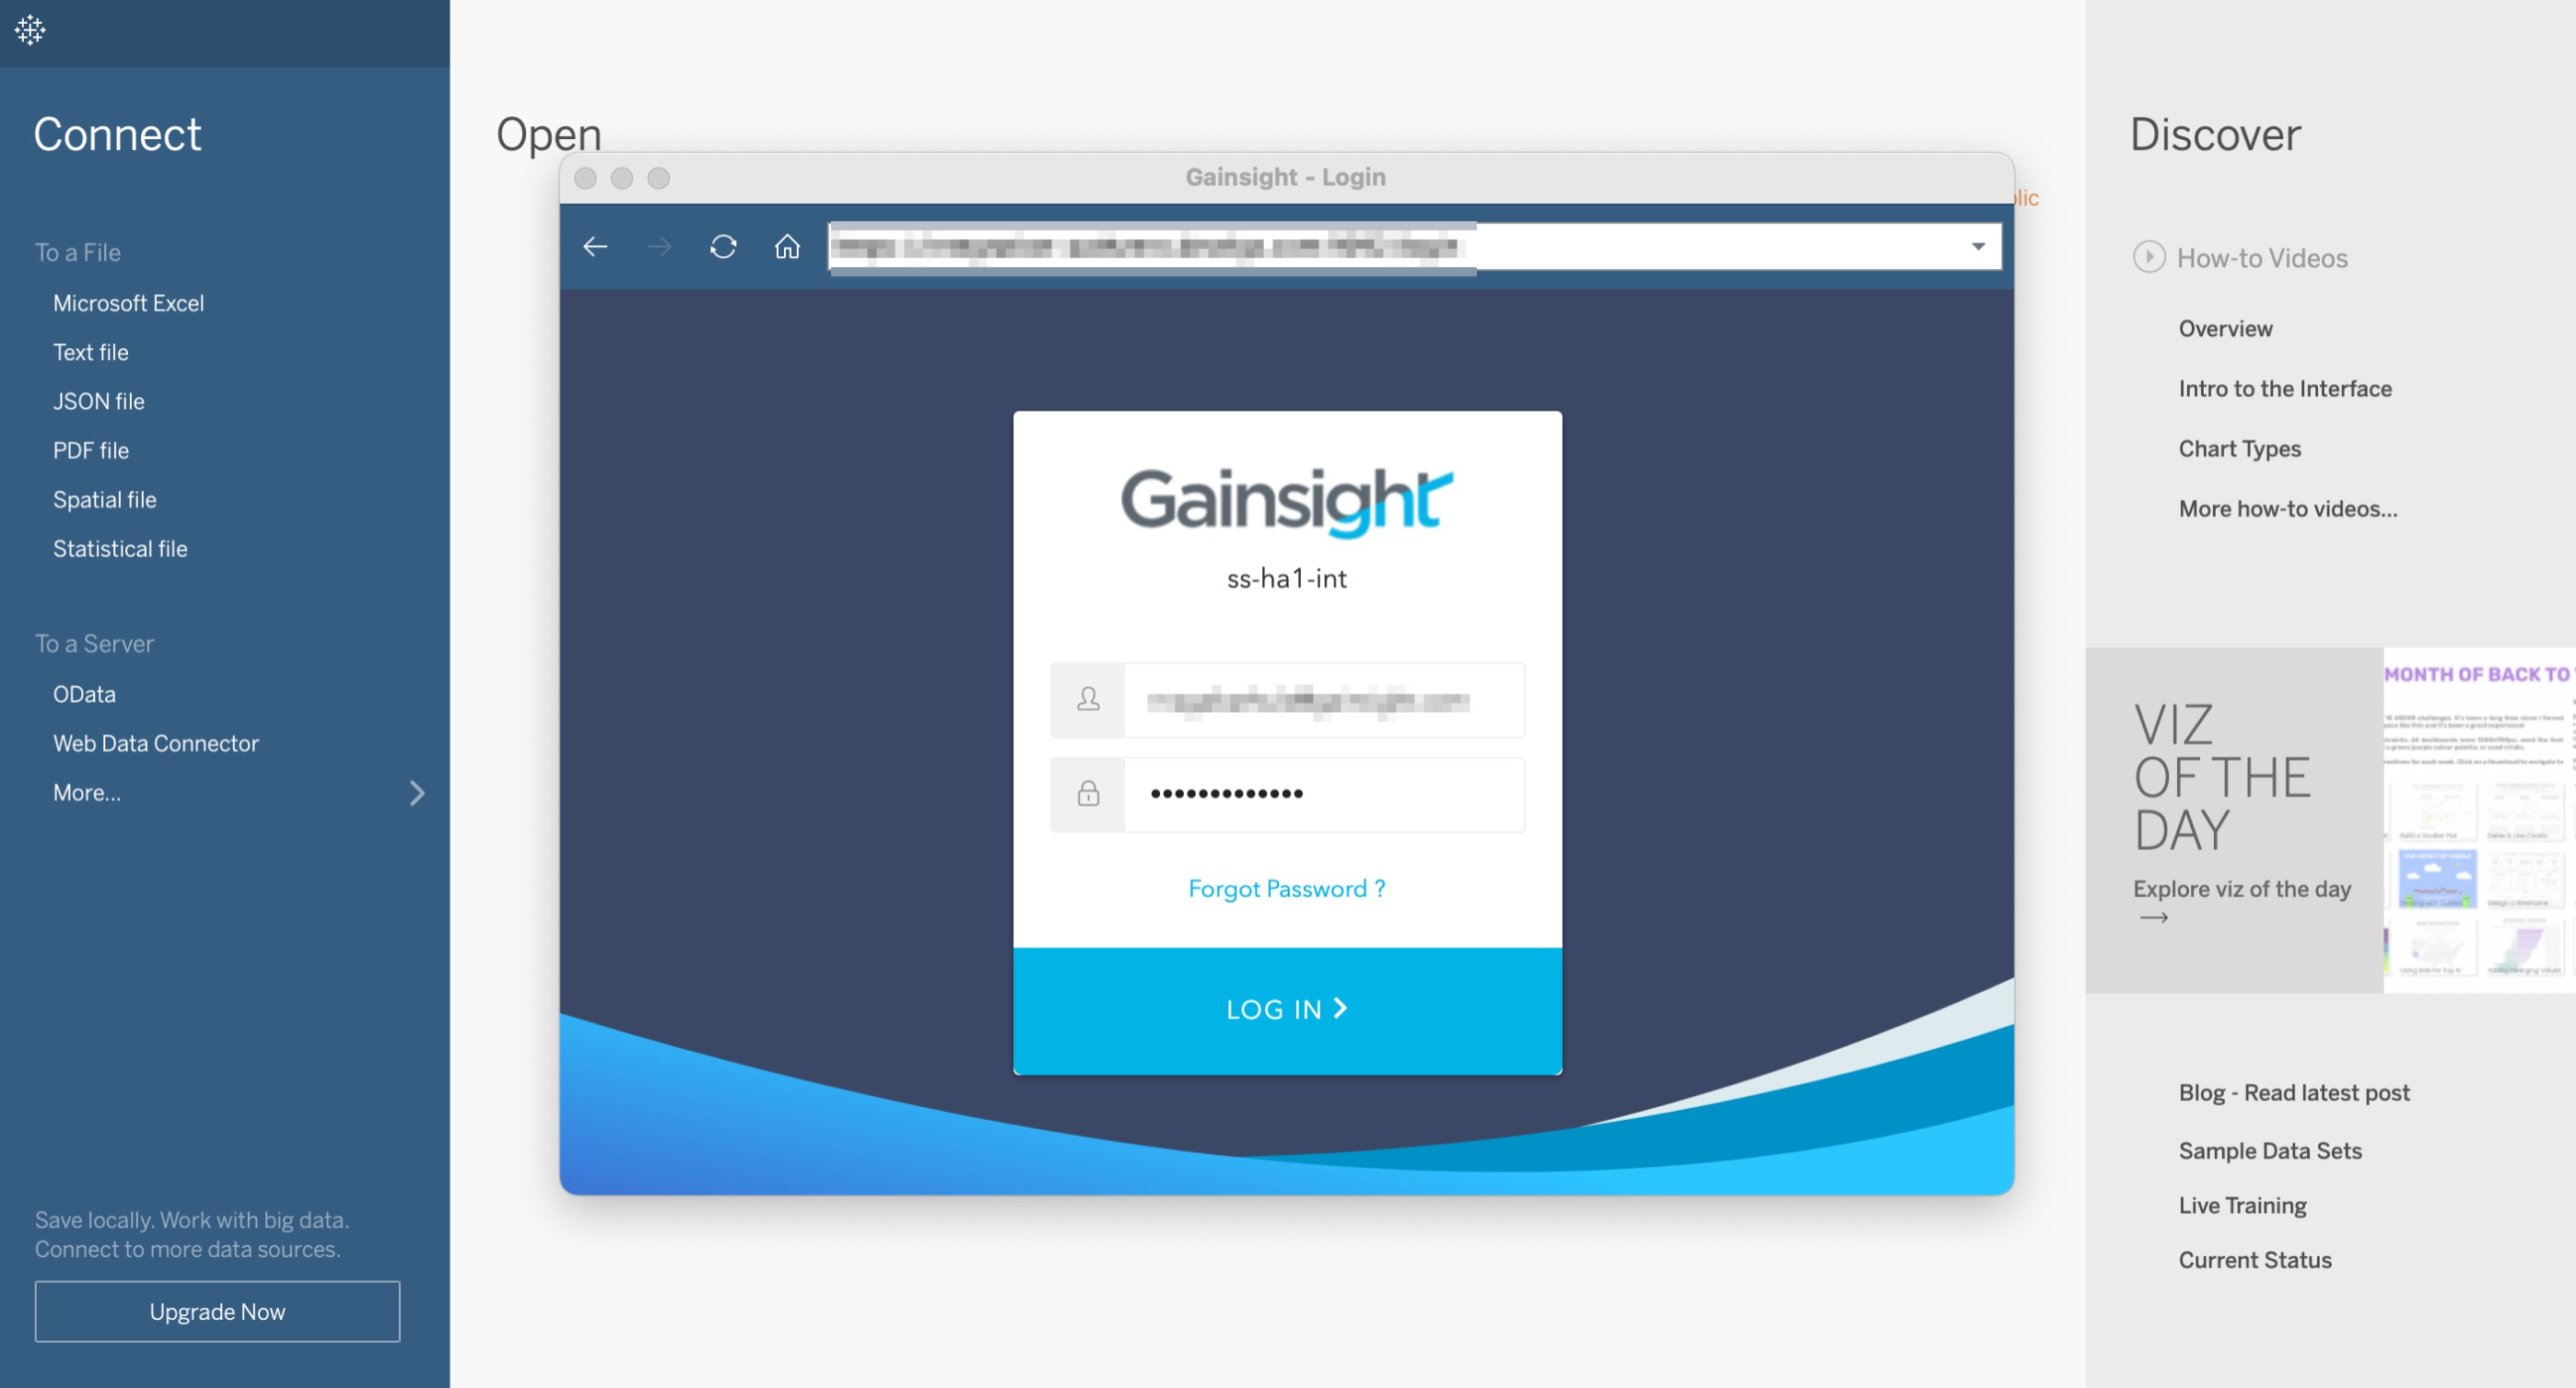
- Enter your Gainsight Domain Name.
- Enter your Username and Password.
- Click Log In. The Tableau Data Source page appears.
Create Sample Report in Tableau
You can build reports on any Gainsight Objects and Application Models (objects) available under Tables and Standard Connection sections respectively. For instance, you might want to report on Company object and see how many numbers of Companies are available in each Stage.
To create a sample report:
- From the Table list, drag and drop the required object to the Drag tables here screen. Here, the object is Company.
- Click Sheet 1.
- Drag and drop the GSID field to the Columns section.
- Drag and drop the Stage field to the Rows section.
- Change the aggregation of the GSID field to Count Distinct.
- Drag and drop the Stage field onto the Color button.
From the above report, you can view the number of Companies that are available in each Stage.